Five-Year Total Cost Comprehensive Vehicle TCO Guide
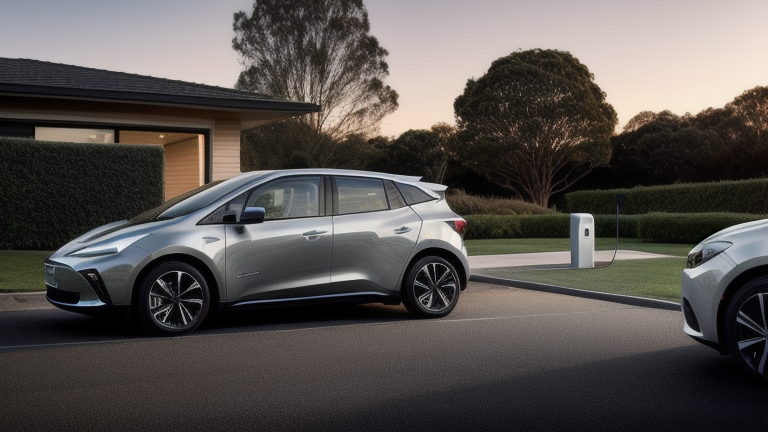
When purchasing a vehicle, most buyers focus almost exclusively on the sticker price or the advertised monthly payment. However, in automotive finance and fleet asset management, the purchase price represents only a fraction of what you will actually pay over time. To understand the real financial commitment of owning a car, SUV, or commercial fleet unit, you must calculate its Five-Year Total Cost—also known as the Total Cost of Ownership (TCO).
At Carri, we evaluate vehicle lifecycles beyond showroom pricing. This guide delivers a data-backed breakdown of the Five-Year Total Cost framework, revealing how hidden operational expenses accumulate and how smart asset management saves thousands over time.
Sticker price comparisons between a petrol hatchback and its electric equivalent miss most of the real financial picture. Depreciation, energy cost, and maintenance accumulate very differently over a five-year ownership period. Building out the full illustrative math — not just the purchase price — shows where the actual gap lands.
Setting Up the Illustrative Model
Assume a driver covers 20,000 km per year, 100,000 km total over five years — a reasonable average for a daily-use compact vehicle. Take an illustrative base purchase price of $24,000 for the petrol hatchback, with the EV equivalent priced $4,000 higher at $28,000 (a generic premium reflecting typical EV pricing patterns, not any specific named model). All figures below are illustrative and built for comparison purposes, not quotes for any actual vehicle.
Energy Cost Over 100,000 km
Petrol hatchback: an illustrative consumption rate of 6.5 L/100km at $1.70/L works out to:
100,000 km ÷ 100 × 6.5 L × $1.70/L = $11,050 in fuel over five years
EV equivalent: an illustrative consumption rate of 16 kWh/100km charged primarily at home at $0.18/kWh works out to:
100,000 km ÷ 100 × 16 kWh × $0.18/kWh = $2,880 in home energy over five years
That’s a difference of $8,170 in energy costs alone over the five-year, 100,000 km period — the single largest line item separating the two vehicles in this model, assuming charging happens predominantly at lower-cost home rates rather than public fast-charging, which typically carries a meaningfully higher per-kWh price.
Maintenance Over Five Years
Illustrative annual maintenance: $450/year for the petrol hatchback (oil changes, filters, belts, and the broader wear-item schedule an internal combustion engine requires) versus $280/year for the EV (no oil changes, fewer moving parts in the drivetrain, though tire wear and brake-fluid service still apply to both).
| Item | Petrol hatchback (5yr) | EV (5yr) |
|---|---|---|
| Annual maintenance estimate | $450/yr → $2,250 total | $280/yr → $1,400 total |
| Energy cost (100,000 km) | $11,050 | $2,880 |
Depreciation: The Counterweight
Depreciation works against the EV in this illustrative model because of its higher $28,000 starting price, even assuming a slightly better residual-value percentage. Using an illustrative 55% five-year depreciation rate for the petrol hatchback ($24,000 × 0.55 = $13,200 lost) and a slightly better illustrative 52% rate for the EV ($28,000 × 0.52 = $14,560 lost):
| Cost category | Petrol hatchback | EV |
|---|---|---|
| Depreciation (5yr) | $13,200 | $14,560 |
| Maintenance (5yr) | $2,250 | $1,400 |
| Energy (5yr, 100,000 km) | $11,050 | $2,880 |
| Total (5yr) | $26,500 | $18,840 |
Reading the Bottom Line
In this illustrative model, the EV’s higher purchase price and slightly worse absolute depreciation are more than offset by its dramatically lower energy cost over 100,000 km, producing a total five-year cost of $18,840 versus $26,500 for the petrol hatchback — a gap of $7,660 favoring the EV. The energy-cost line is doing almost all of the work here; change the assumed electricity price (for instance, if charging relies heavily on public fast-charging rather than home charging) or the assumed petrol price, and this gap narrows or widens substantially.
Where This Model Can Break Down in Reality
- Charging mix: a driver without home charging access who relies mainly on public DC fast charging could see EV energy costs rise close to, or in some regions above, petrol-equivalent cost per km, largely erasing the advantage shown above.
- Insurance: EV insurance premiums are sometimes higher than equivalent petrol vehicles in some markets due to repair-cost and parts-availability factors; this model doesn’t include insurance, and it’s worth getting a real quote for both options before deciding.
- Battery replacement risk: this model assumes no major battery replacement within five years, which is typical for current EVs under normal use and within most manufacturer battery warranties, but it is a real cost exposure outside the warranty period that a purely petrol vehicle doesn’t carry in equivalent form.
- Resale market conditions: depreciation percentages used here are illustrative; actual residual values shift with fuel prices, incentive programs, and used-vehicle demand at the specific time of resale.
Building Your Own Version of This Model
The structure — purchase price difference, plus energy cost difference over your actual annual mileage, plus maintenance difference, plus depreciation difference — transfers to any specific pair of vehicles you’re comparing. Swap in your local fuel price, your local electricity rate (and your realistic home-vs-public charging mix), and quoted maintenance figures for the actual models under consideration, and the same four-line framework will give you a far more grounded comparison than purchase price alone.
A Sensitivity Check Worth Running
Before trusting any single-scenario result, it’s worth re-running the energy-cost line under a less favorable charging assumption. If, for example, 40% of the EV’s charging happens at a public fast-charger averaging $0.40/kWh instead of the $0.18/kWh home rate used above, the blended energy cost rises considerably — roughly to $4,290 over the same 100,000 km instead of $2,880, narrowing the total five-year gap from $7,660 down to about $6,250 in favor of the EV. The EV still comes out ahead in this particular illustrative scenario, but the margin is sensitive to charging habits in a way the petrol side of the comparison simply isn’t, since petrol pricing doesn’t vary based on where you happen to fill up nearly as much as electricity pricing varies between home and public charging.
Why Mileage Assumptions Matter More Than They Look
This model’s advantage for the EV scales directly with distance driven, because the energy-cost gap is the dominant line item and it grows linearly with km driven. A driver covering only 8,000 km per year rather than 20,000 would see the energy-cost advantage shrink proportionally to roughly $3,270 over five years instead of $8,170, while the $1,360 gap in depreciation (working against the EV) stays roughly fixed regardless of mileage. Low-mileage drivers should expect this comparison to favor the EV by a much smaller margin, and in some low-mileage, high-public-charging scenarios the comparison can flip toward the petrol hatchback entirely.
This analysis is illustrative and not a substitute for actual price quotes, your specific insurance quote, or your owner’s manual’s maintenance schedule — treat it as a framework for building your own numbers, not as financial advice for a specific purchase decision.
Conclusion
Evaluating a vehicle solely by its purchase price provides an incomplete financial picture. By analyzing the Five-Year Total Cost, buyers and fleet operators gain clarity on depreciation, insurance, fuel, and upkeep. Partnering with Carri equips you with data-driven insights to manage lifetime auto expenses efficiently.